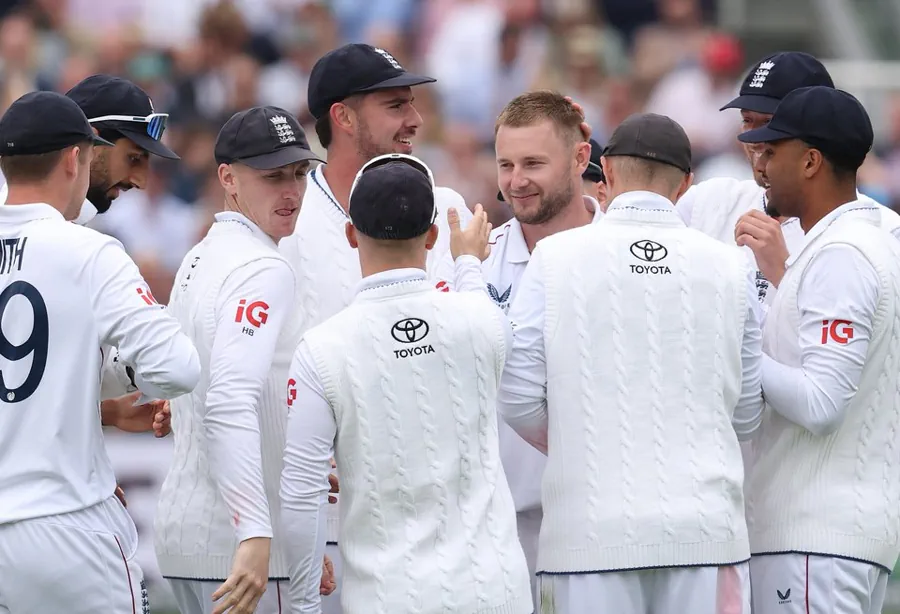
Cricket has always rewarded close attention. A scorecard can record every run, wicket, and over, yet the numbers only become useful when they are connected to conditions and tactics. Modern fans have more information than any previous generation, but better analysis still depends on asking the right questions.

Schedules, live scores, statistical dashboards, and digital services such as 1win crypto now sit alongside television and radio coverage. The extra choice can make following a match more engaging. It can also encourage quick conclusions based on a single percentage or recent result. A sound reading begins with context, not prediction.
The goal is not to turn every viewer into a professional analyst. It is to build a repeatable routine that separates strong evidence from noise. That routine works for Tests, one-day matches, and short-format competitions, although the importance of each factor changes with the format.
Start with the format and match situation
A scoring rate that looks slow in a T20 may be ideal during a difficult morning in a Test. A batter protecting a partner near the end of an innings has a different task from an opener using the fielding restrictions. Raw figures must therefore be read against the rules and the current objective.
Before comparing players or teams, note:
- the format and stage of the competition;
- the number of overs or days remaining;
- wickets in hand;
- the target and required rate, if applicable;
- qualification or series implications.
These details define the problem each side is trying to solve. Without them, strike rate, economy, or partnership length can be misleading.
Conditions shape every statistic
Venue averages are helpful, but they are not permanent laws. A pitch changes through use, weather, preparation, and time of day. Cloud cover may assist swing; heat can dry a surface; dew can make gripping the ball difficult. Boundary dimensions and altitude also alter the value of a shot.
The toss should be examined as a decision made with imperfect information. If a captain chooses to bowl, ask what conditions were expected and whether they appeared. Judging the call only from the final result ignores the quality of the reasoning at the time.
Comparisons should favor matches played under similar circumstances. A bowler’s figures on a slow surface cannot be placed beside returns on a flat ground without qualification. Splitting data by venue, innings, opponent, or phase often reveals a more realistic pattern.
Read batting numbers by phase
An overall strike rate can hide how an innings developed. A player may begin cautiously against the new ball, accelerate against spin, and slow again when wickets fall. Breaking the innings into phases shows whether the approach matched the situation.
Useful questions include:
- How many dot balls occurred, and where?
- Which bowlers restricted scoring?
- Did boundary attempts increase at a sensible time?
- How did the batter respond after a wicket?
- Was rotation of strike available?
Control matters as much as outcome. An edged four and a well-placed drive add the same runs but offer different evidence about future deliveries. Wagon wheels, false-shot percentages, and scoring zones can help, provided they are not treated as substitutes for watching the ball.
Bowling analysis goes beyond wickets
Wickets are decisive, but a bowler can influence a match without taking one. Tight overs create pressure that produces a mistake at the other end. Conversely, a wicket from a poor delivery does not necessarily prove a strong spell.
Economy should be read by phase. Powerplay overs, middle-overs control, and death bowling require different plans. Line, length, pace variation, and field setting show whether the bowler executed the intended method.
For a fuller assessment, examine:
- dot-ball rate;
- boundary frequency conceded;
- changes in length and speed;
- performance against right- and left-handed batters;
- chances created, including dropped catches.
Expected or impact-based models can add perspective, but their definitions differ. Fans should check what a metric includes before comparing values from separate providers.
Partnerships explain momentum
Cricket is built around pairs. A partnership may be valuable because it scores quickly, survives a dangerous spell, or gives a set batter most of the strike. Its importance cannot be reduced to total runs.
Look at how the pair divided responsibilities. Did one player attack while the other rotated? Did they target a particular bowler? Did running between the wickets force a field change? These choices reveal why momentum shifted.
Bowling partnerships matter too. Pressure is often created across consecutive overs. Reviewing only the wicket-taking delivery overlooks the sequence that made the error more likely.
Fielding data needs careful interpretation
Catches and run-outs are easy to count, while positioning and prevention are harder to measure. A fielder may save several boundaries without appearing in the headline statistics. Another may be credited with a catch created mainly by the bowler and captain’s plan.
When possible, consider missed chances, ground fielding, throwing accuracy, and movement between positions. The quality of a chance matters: a difficult diving opportunity should not be treated like a routine drop.
Field placements also provide tactical clues. A change at cover or fine leg may invite a specific shot. Watching how the bowler responds completes the picture.
Recent form can be overstated
A sequence of three matches attracts attention, but small samples fluctuate. Opponent strength, role changes, and conditions may explain the movement. Career averages, recent form, and matchup history should be viewed together rather than used selectively.
The same caution applies to head-to-head records. Teams change players and coaches; venues and formats differ. An old result has limited relevance unless the underlying conditions resemble the current match.
A sensible hierarchy is:
- current role and availability;
- conditions and likely matchup;
- performance across a meaningful sample;
- recent evidence that suggests a genuine change.
Narratives are most reliable when supported by several kinds of evidence.
Check the source and definition
Not every dashboard calculates statistics in the same way. Some exclude rain-reduced matches, super overs, or abandoned innings. Others update live and may correct data later. A difference between sources is not automatically an error.
Fans should prefer providers that explain their methodology and timestamps. Screenshots circulating on social media may omit labels or filters. If a number seems surprising, return to the original scorecard before sharing it.
Digital account safety also matters. Use unique passwords, enable two-step verification, and avoid entering payment information through links received in unsolicited messages. Data literacy and security are now part of the same online match-day routine.
Build a simple review habit
The most useful analysis can fit on one page. Before the match, record conditions, team changes, and expectations. At the innings break, note the decisive phases. After the result, compare those notes with the scorecard without rewriting the earlier view to fit the outcome.
This habit reduces hindsight bias. It also shows which indicators genuinely helped and which merely sounded persuasive. Over time, fans learn that uncertainty is not a flaw in cricket analysis; it is a feature of a sport shaped by weather, surfaces, human decisions, and small moments.
Numbers deepen enjoyment when they support observation. They should not erase the story unfolding on the field. By combining format, conditions, roles, and reliable data, a fan can understand more while preserving the unpredictability that makes cricket compelling.